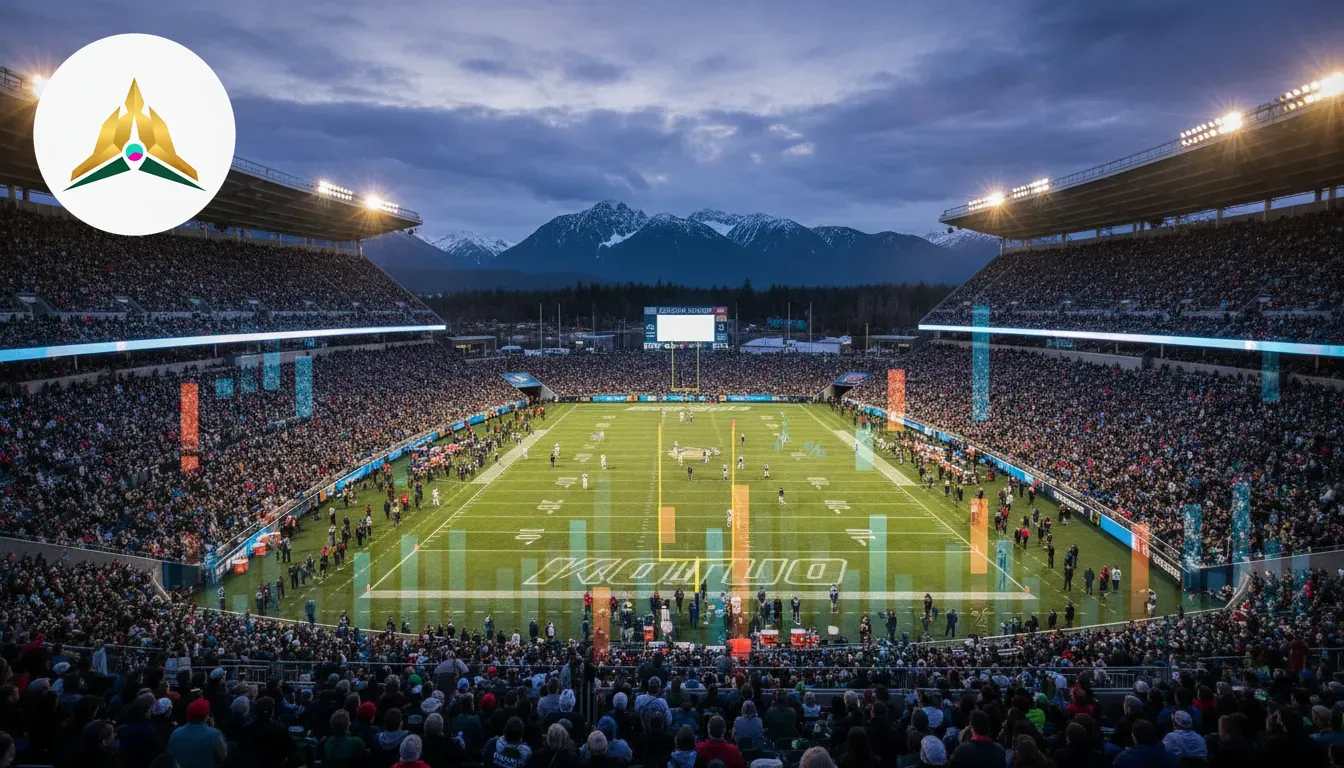
Locate the specific NFL fixture on the consensus board and verify whether the displayed data reflects point spreads, totals, or moneyline markets. Each category carries distinct wagering volume profiles; recreational bettors often concentrate on outright winners, whereas point spreads typically present more balanced action across both sides.
02Check Ticket Percentages (Bet Count)
Review the Bet % or Ticket % column to determine the overall distribution of individual betting slips. If a team attracts 75% of total tickets on a 3.5-point spread, this metric confirms strong public popularity and brand recognition driving casual wagers, though it does not reveal the actual capital staked.
03Evaluate Money Percentages (Total Handle)
Examine the Money % or Handle % column to measure the proportion of total dollars wagered on each outcome. When a team receives 75% of the ticket count but only 42% of the money handle, the opposing side holds a much higher average wager size, indicating substantial individual commitments from experienced bettors.
04Identify Gaps Between Bets and Handle
Calculate the variance between ticket volume and handle share on both sides. A substantial split—where the minority side holds an outsized share of total dollars—frequently indicates smart money exposure. Operators monitor these gaps to balance risk, as large-denomination wagers carry greater liability than numerous small recreational bets.
05Correlate Percentages with Line Movement
Compare the consensus splits against the historical shift from the opening number to the current price. When an NFL spread moves against the heavy ticket majority, it reveals reverse line movement, confirming that operators are actively adjusting lines to respect high-stakes wagers rather than balancing simple ticket volume.
Understanding Betting Percentages
Public betting data is generally split into two distinct metrics: ticket counts (the percentage of individual wagers placed) and handle (the percentage of total dollars wagered). Tracking these two numbers independently reveals where casual public money is clustering versus where larger, high-stakes capital is positioned.
When a team commands 75% of the total ticket count but holds only 40% of the financial handle, it signals a classic recreational favorite scenario. Sportsbooks frequently adjust their lines to manage the heavy volume of smaller tickets, even if the absolute liability in dollars is lower on that side.
Key Data Points to Track
Spread Betting Splits
Tracks total ticket counts and cumulative handle placed against the point spread.
📊
Moneyline Volume
Compares outright winner wagers to identify market sentiment without point spreads.
💵
Totals Consensus
Measures public action on over versus under outcomes across posted scoring lines.
📈
Ticket Money Splits
Reveals divergence between recreational volume and larger stakes from sharper syndicates.
⚖️
Opening Line Comparison
Highlights initial bookmaker numbers against current market prices to reveal true shifts.
🔄
Historical Movement Logs
Details chronological price adjustments and key injury triggers leading up to kickoff.
⏱️
NFL Line Movement Explained
Line movement reflects how sportsbooks react to incoming wagers, market news, and professional syndicate action. An opening point spread is calculated using power ratings and statistical models, but the number shifts dynamically from Monday through Sunday kickoff as money enters the market.
Reverse line movement occurs when a point spread moves in the opposite direction of the prevailing ticket majority. For instance, if 70% of wagers are placed on Team A at -3, but the line drops to -2.5, it typically indicates that sharp, high-limit wagers have landed on Team B, forcing the sportsbook to adjust.
Strategic Applications of Splits
🎯
Spot Contrarian Value
Isolate inflated point spreads when over 75% of ticket counts back one side.
📊
Identify Sharp Positions
Compare handle share against ticket percentages to detect high-stake syndicates.
🔄
Detect Reverse Moves
Spot betting lines shifting toward underdogs despite heavy public ticket volume.
⚖️
Validate Power Ratings
Cross-check proprietary handicap models against consensus market exposure.
⏱️
Gauge Market Reaction
Evaluate actual book risk adjustments instead of overreacting to media noise.
📈
Exploit Key Numbers
Capitalize when public volume pushes spreads through critical margins like 3 and 7.
Isolating these metrics helps analysts determine whether a line move is driven by public popularity or respected money. While recreational bettors tend to back marquee quarterbacks, prime-time favorites, and high-scoring offenses, professional syndicates look for mathematical edges across key numbers like 3, 7, and 10.
Combining consensus splits with power ratings provides a structured framework for evaluating weekly NFL matchups. Bettors who monitor both ticket counts and handle distributions can better assess market exposure and identify potential value when public sentiment overreacts to recent team performances.
NFL Public Betting FAQ
What is the difference between ticket count percentages and money percentages in NFL betting?
Ticket count represents the total volume of individual wagers placed on a specific market, reflecting general public interest across casual bettors. Money percentage measures the actual share of total wagered handle on that outcome. A significant divergence—such as 70% of tickets on one side but only 45% of the total handle—indicates that larger, higher-stake wagers are backing the opposite side.
How does reverse line movement signal sharp betting activity?
Reverse line movement happens when a point spread or game total shifts in the direction contrary to public ticket consensus. For instance, if 78% of public bets back a home favorite, yet sportsbooks move the line from -6.5 down to -6, operators are adjusting risk in response to respected, high-stakes wagers on the underdog. Comparing these shifts with our betting odds guide helps identify where professional market influence lies.
What threshold indicates an actionable public betting split on NFL spreads?
A split becomes analytically significant when ticket volume exceeds 65% to 70% on a single side, accompanied by at least a 15% to 20% disparity against the money percentage. When 80% of wagers back an over on a 44.5 total but 60% of the handle sits on the under, it highlights clear public agreement opposed by larger single wagers.
Is fading the public a sustainable standalone strategy for NFL matchups?
Blindly betting against high-consensus public sides does not yield consistent long-term returns on its own. While heavy public favorites and prime-time overs often carry inflated numbers due to recreationally biased volume, sustained profitability requires cross-referencing public percentages with key scoring numbers (such as 3, 7, and 10), injury reports, and weather forecasts rather than betting purely against the crowd.
Why do NFL public betting percentages fluctuate throughout the week?
Early-week percentages represent initial market entry from price-sensitive bettors taking advantage of opening numbers. As game day approaches, recreational turnover surges, frequently shifting percentages back toward popular marquee franchises. In addition, late injury updates, practice reports, and changing weather conditions trigger sudden adjustments in point spreads and game totals.
How are public consensus percentages aggregated across sportsbooks?
Consensus percentages aggregate betting ticket distribution and total money handle reported by multiple licensed sportsbooks across regulated markets. These weighted metrics deliver an overarching view of market exposure, smoothing out localized bookmaker variances where regional fandom could otherwise distort a single operator's numbers.
How do public betting splits in football compare to other major sports leagues?
The NFL generates substantially higher recreational betting volume per game than leagues with daily schedules like hockey or soccer. Because casual wagers heavily lean into favorites and overs in standalone televised matchups, football point spreads exhibit more pronounced public bias than markets detailed in our hockey betting guides or soccer match previews.
About the Author
Frank Costello
Senior NFL Odds & Market Analyst
Frank Costello has tracked North American football markets for over 14 years, specializing in pricing mechanics, market volatility, and mathematical point spread distributions. Prior to joining Tw Dd as a lead analyst, he worked in risk management and quantitative line setting, focusing on key number volatility around margins of 3 and 7. His analysis centers on helping players dissect market movement, apply disciplined bankroll protocols, and leverage practical betting tools alongside real-time public betting trends to evaluate line value objectively.