

How to Read Sports Betting Odds

How to Read Sports Betting Odds

A clear breakdown of American, decimal, and fractional lines, calculating implied probability, and payout mechanics.

The Fundamentals of Betting Odds

Sports betting odds represent two core elements: the implied probability of an outcome occurring in an athletic event, and the expected payout relative to the stake. Every price quoted on a match—from standard match-winner selections to specialized point spread markets—is an expression of risk calculated from statistical models, team metrics, roster health, and historical data. Translating these figures into a workable percentage allows bettors to assess whether a given market offers positive expected value against real-world performance indicators.

Beyond individual matchups in leagues like the NHL or NFL, odds fluctuate dynamically as market sentiment shifts and new information emerges. When calculating potential returns across complex tickets or live betting markets, understanding the mechanics behind baseline prices prevents costly miscalculations. Utilizing analytical resources and dedicated betting tools enables a disciplined approach to tracking price movement and assessing the true margin built into any published line.

Evaluating Plus and Minus Symbols

  1. The Favorite (-)

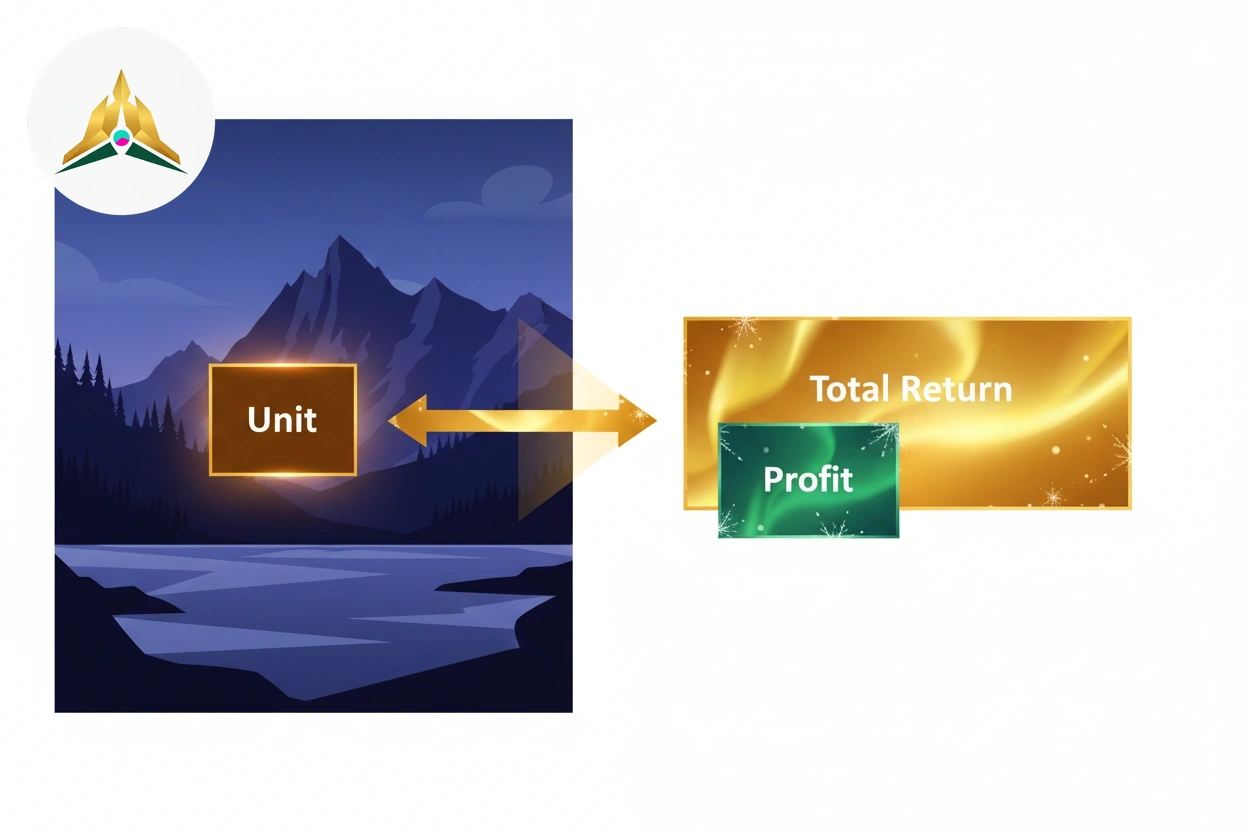
    In standard North American pricing formats, a minus sign (-) identifies the side assessed by oddsmakers as more likely to win. The integer following the minus symbol defines the exact stake required to return a baseline profit of 100 units. For instance, odds of -150 mean a bettor must commit 150 units to secure 100 units in net winnings. A heavier favorite listed at -300 reflects a substantially higher implied probability, requiring three times the stake relative to the potential return.

  2. The Underdog (+)

    Conversely, a plus sign (+) denotes the underdog or the selection carrying a lower projected win probability. The numeric value indicates the net payout earned on a successful 100-unit wager. If an underdog is quoted at +140, a 100-unit stake yields 140 units of profit in addition to the returned stake. Comparing these relative values across standard moneyline markets or point spreads allows bettors to quickly quantify risk profiles.

American Odds Benchmarks

  • -110Standard Spread Price
  • -200Heavy Favourite Line
  • +150Moderate Underdog Price
  • +500Longshot Market Return

Understanding Different Odds Formats

Step-by-Step Payout Calculations Across Formats

Calculating Negative American Odds (Favorites)
Negative American odds state how much must be staked to generate 100 in pure profit. The standard formula is: Profit = Stake × (100 / Absolute Odds Value). For example, placing a 75-unit wager at odds of -150 yields 75 × (100 / 150) = 50 units in profit, returning 125 units in total payout once the original stake is refunded.
Calculating Positive American Odds (Underdogs)
Positive American odds represent the net profit returned on a successful 100-unit stake. The calculation formula is: Profit = Stake × (Odds / 100). If an underdog displays +220 and the wager is 50 units, the net profit equals 50 × (220 / 100) = 110 units, producing a complete return of 160 units.
Converting and Calculating Decimal Odds
Decimal odds represent total return per unit wagered, incorporating both the original risk and the net gain. The direct calculation formula is: Total Payout = Stake × Decimal Odds. A 40-unit selection priced at 2.75 pays 40 × 2.75 = 110 units total, which breaks down to 70 units of profit plus the returned 40-unit stake. Explore dedicated calculation resources to automate these conversions.
Evaluating Fractional Odds Ratios
Fractional odds show the ratio of profit relative to the risk amount. The formula is: Profit = Stake × (Numerator / Denominator). A 30-unit bet at odds of 5/2 results in 30 × (5 / 2) = 75 units of profit, delivering an aggregate payout of 105 units when settled successfully.
  • Moneyline Wagers

    Post-Game

    Single-game moneyline outcomes settle immediately once official league statistics finalize.

  • In-Play Markets

    Real-Time

    Micro-markets and next-play wagers clear rapidly during live betting match pauses.

  • Parlay Slips

    Final Leg

    Multi-selection tickets verify through an automated calculator once every leg concludes.

Evaluating Odds Presentation Formats

Format AdvantagesFormat Limitations
Decimal Total Return SimplicityMultiplying the base stake directly by the decimal figure provides the exact gross return, making multi-leg accumulator evaluation straightforward.Decimal Hidden Stake SeparationBecause decimal values reflect gross returns, bettors must manually deduct their stake to determine the actual net profit margin.
American Visual Market ClarityThe plus and minus symbols immediately establish the underdog and favorite status relative to a standardized 100-unit baseline.American Irregular Stake FormulasCalculating exact returns on non-standard wager sizes requires multi-step math unless using specialized digital calculation tools.
Fractional Net Profit DisplayThe ratio format clearly displays pure net profit against the risked amount, keeping the original stake separate from projected earnings.Fractional Denominator ComparisonsAssessing small value discrepancies between fractions with dissimilar denominators, such as 11/4 versus 13/5, can slow down line evaluation.

How Odds Are Calculated and Priced

Pricing an athletic event begins with raw probability modeling. Quantitative analysts and odds compilers review extensive historical datasets, player availability, travel schedules, and tactical matchups. These variables feed into simulation algorithms and analytical models that output a true probability for each outcome, establishing the statistical baseline before commercial factors enter the equation.

To transform true probabilities into listed prices, sportsbooks embed a theoretical margin known as the overround or vig. This built-in percentage ensures that the combined implied probabilities for all potential results exceed 100%, establishing an operational margin. Once public trading begins, incoming liquidity and high-volume wagers prompt calibrated line adjustments to manage book liability across competing sides.

Calculating Implied Probability

  1. Implied probability translates listed betting odds into a concrete percentage representing the expected likelihood of an outcome. Sportsbooks incorporate their theoretical hold or house margin into these figures, which causes the combined percentages in a balanced two-way market to sit between 104% and 108% rather than an even 100%. When evaluating matchup prices across standard markets like the NHL puck line, deriving this baseline percentage is the primary step in identifying discrepancies between published lines and statistical projections.

  2. Converting prices into percentages requires distinct calculations based on the format polarity. For negative American figures like -150, divide the absolute odds by the sum of the odds plus 100 (150 / 250 = 60.0%). For positive figures like +130, divide 100 by the price plus 100 (100 / 230 = 43.48%). Benchmarking these exact threshold rates against analytical projections or dedicated betting tools determines whether an individual selection offers genuine mathematical value.

  • 58.3%-140 Implied Probability
  • 52.4%-110 Standard Line
  • 50.0%+100 Even Money
  • 33.3%+200 Underdog Conversion

Pricing Adjustments and Market Shifts

Initial opening lines originate from complex quantitative models and statistical simulations before any public capital enters the pool. Oddsmakers compile historical performance metrics, player health updates, travel logistics, and tactical matchup statistics to calculate baseline probabilities. Once these opening figures are posted, risk management teams monitor how early liquidity affects their exposure across both sides of the market.

When a substantial portion of the wagered handle backs a specific outcome, trading desks actively adjust prices to balance liability rather than absorb directional risk. These adjustments shift the numbers to attract balanced volume on the opposing selection. Reviewing market movements with dedicated betting tools alongside verified public betting data helps clarify whether a line shift stems from broad volume or targeted early moves by professional syndicates.

  • True Probability (No Vig)

    +100 / +100

    A balanced 50/50 outcome reflects even odds on each side with zero bookmaker hold.

  • Standard Adjusted Market

    -110 / -110

    Sportsbooks price balanced sides at -110, raising the implied probability to 52.38% per selection.

  • Operator Margin

    4.76% Vig

    Total market probability equals 104.76%, creating the built-in profit margin measured by betting tools.

Odds in Action: Common Bet Types

  • Outright Moneylines

    Calculates returns strictly on outright winners, balancing risk between favorites and underdogs.

  • Point Spread Pricing

    Incorporates a handicap margin, balancing payout odds near standard -110 rates on both sides.

  • Game Totals (Over/Under)

    Prices hinge on combined aggregate scores, offering equalized lines for higher or lower results.

  • Parlay Compounding

    Combines individual market prices into a single slip with exponentially scaled payout ratios.

  • In-Play Live Adjustments

    Shifts real-time prices dynamically as elapsed match time, scoring, and momentum fluctuate.

Totals and Moneyline Pricing

Beyond point spreads, moneyline selections represent the most straightforward format in sports wagering by focusing entirely on the outright winner. When backing a heavy favourite listed at negative odds such as -250, a bettor risks 250 units to return 100 units in profit. Conversely, an underdog priced at +210 yields 210 units in profit on a 100-unit stake upon securing an upset. In low-scoring sports detailed in our ice hockey guide, overtime and shootout rules determine whether three-way regulation lines or standard two-way moneylines govern the settlement.

Over/Under totals evaluate the aggregate offensive output of both teams combined rather than picking a side. Oddsmakers establish a projected baseline, such as 47.5 points for a gridiron contest, and balance risk across both sides of the figure. Bettors evaluating tempo and red-zone efficiency with our football betting guide can determine whether the game script favours an explosive passing matchup on the over or a ball-control defensive battle on the under.

Totals and Over Under Lines

  1. Betting the Over

    When evaluating a totals market, sportsbooks project the aggregate score generated by both sides combined. If an NFL matchup lists a line at 47.5 points with -110 odds, wagering on the Over requires at least 48 total points at the final whistle (for example, a 28–20 final score). Half-point fractions, commonly known as hooks, ensure the market settles strictly as a win or loss without the possibility of a tie.

  2. Betting the Under

    Taking the Under on that identical 47.5 benchmark means the cumulative score must finish at 47 points or fewer (such as a 24–20 outcome). While standard prices sit balanced near -110 on both options, shifts in market volume or injury updates can prompt odds adjustments. When sportsbooks post whole numbers, such as 6.0 in ice hockey totals, an exact six-goal outcome results in a push where the original stake is refunded.

Why Betting Odds Fluctuate

Sportsbook pricing is dynamic rather than static. Opening numbers represent an oddsmaker’s initial mathematical projection, but as wagering volume enters the market, lines adjust to balance potential liability. When substantial capital concentrates on a single side, trading desks adjust the price or the point spread to make the opposing outcome more attractive to incoming wagers. This risk management practice protects the sportsbook from disproportionate exposure on any single result.

Beyond betting handle distribution, external catalysts cause rapid repricing. Key player injuries announced during pre-game warmups, tactical lineup adjustments, or sudden weather shifts instantly force models to update their underlying probabilities. In fast-paced in-game environments featured across live betting markets, algorithms recalculate every price in real time based on clock management, pitch count, and possession changes.

  • 75%+Public Consensus Threshold
  • 1.5–3.0Key Injury Point Shift
  • 10–20%Severe Weather Variance
  • < 30 MinSharp Action Velocity

Opening Numbers and Market Adjustments

  1. Opening lines represent the initial baseline established by oddsmakers before public liquidity enters the market. In a standard ice hockey or football matchup, this opening figure reflects raw statistical models, roster updates, and historical performance metrics. Analysts set these initial numbers to gauge market sentiment and establish a balanced starting price.

  2. When substantial capital enters on one side of a matchup, sportsbooks adjust the price to manage overall liability. Monitoring market line movement reveals how heavy volume on a -140 favourite can push the odds to -155 or move a point spread by a half-point, making the opposing side more attractive to balance incoming action.

Reader Experiences with Our Odds Analysis

The breakdown of American plus-minus lines versus decimal formats clarified how bookmaker margins are calculated across different markets.
Liam M., Calgary
Learning to convert moneyline odds into implied probability percentages made comparing NHL puck lines and totals much clearer.
David K., Ottawa
The explanations of vigorish and line movement helped me evaluate point spreads objectively before placing soccer wagers.
Sarah P., Vancouver

Betting Odds FAQ

What do the plus and minus signs mean in American odds?
A plus sign (+) indicates the underdog and represents the net profit returned on a 100-unit stake. A minus sign (-) designates the favorite and specifies how many units must be wagered to generate a 100-unit profit.
How do decimal odds differ from fractional odds?
Decimal odds represent total payout per unit wagered, incorporating both the original stake and the profit (for example, odds of 2.50 return 25 units on a 10-unit stake). Fractional odds, common in traditional markets, express only the profit relative to the stake, such as 3/2 returning 15 units of profit on a 10-unit bet.
How is implied probability calculated from betting lines?
For decimal odds, divide 1 by the decimal price (e.g., 1 / 2.00 = 50%). For negative American odds, divide the line by the line plus 100 (e.g., 150 / 250 = 60%). For positive American odds, divide 100 by the line plus 100 (e.g., 100 / 250 = 40%).
What does a standard -110 line signify in point spreads and totals?
A -110 line indicates that a bettor must risk 110 units to gain 100 units of profit. The extra 10 units represent the bookmaker commission (vigorish), creating a 52.38% breakeven threshold for long-term profitability.
Why do betting odds change after they are published?
Odds fluctuate due to heavy betting volume on one side, injury updates, starting lineup announcements, weather conditions, or tactical line management by risk traders. You can monitor how in-game events cause dynamic shifts through our live betting overview.
What is the practical difference between a moneyline and a point spread?
A moneyline wager requires only picking the outright winner of an event regardless of score margin. A point spread introduces a handicap where the favorite must win by more than a specified margin, while the underdog can lose by less than that margin or win outright to cover, as detailed in our hockey betting guide.

About the Author

Frank Costello, Senior NFL Odds Analyst at Tw Dd

Frank Costello

Senior NFL Odds & Market Analyst

Frank Costello has tracked North American football markets for over 14 years, specializing in pricing mechanics, market volatility, and mathematical point spread distributions. Prior to joining Tw Dd as a lead analyst, he worked in risk management and quantitative line setting, focusing on key number volatility around margins of 3 and 7. His analysis centers on helping players dissect market movement, apply disciplined bankroll protocols, and leverage practical betting tools alongside real-time public betting trends to evaluate line value objectively.